What you'll learn
On this page
An order block is the zone where a strong move started. In Smart Money Concepts, it is where we look to enter after liquidity has been taken and structure has shifted. This lesson shows you how to find the right candle, how to judge whether the zone is worth trading, and how to plan entry, stop and target, with a real gold example at the end.
If you have not read it yet, start with Liquidity in Gold Trading. Order blocks make much more sense once you know what price is hunting.
What an order block is
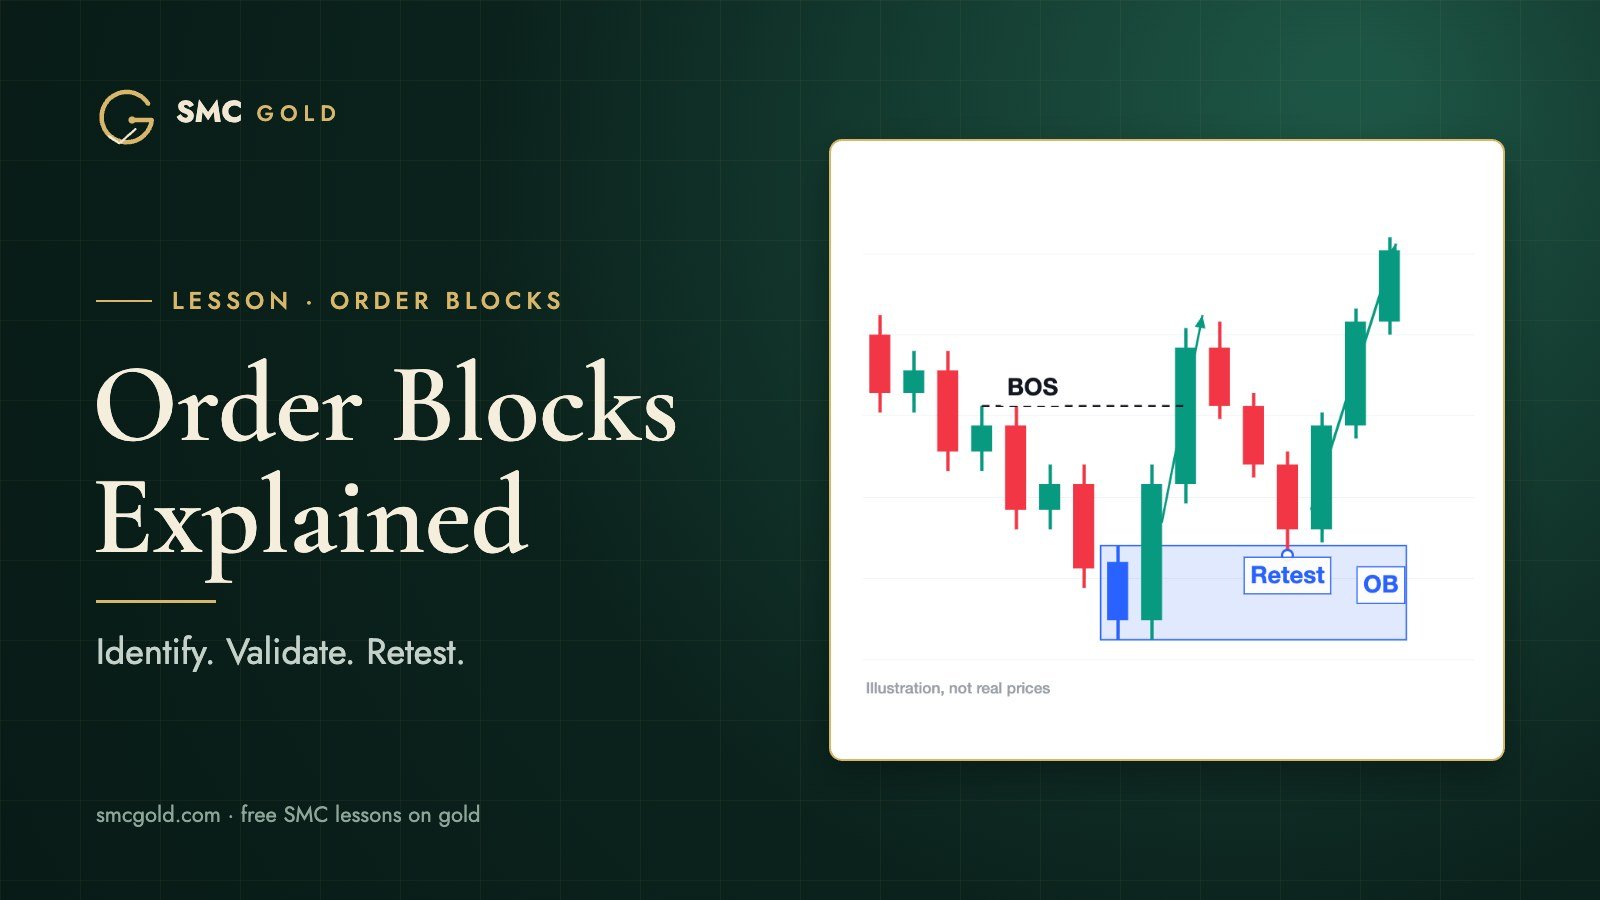
An order block (OB) is the last opposite-colour candle before a strong move that breaks structure.
- A bullish order block is the last down (bearish) candle before a strong move up.
- A bearish order block is the last up (bullish) candle before a strong move down.
The usual explanation is that large orders were filled around that price, and that a return to the zone can meet unfilled orders or traders defending positions. You cannot see orders on a candle chart, so treat this as an interpretation: what the chart actually shows is where a strong move began and whether price reacts there again.
How to find the right candle
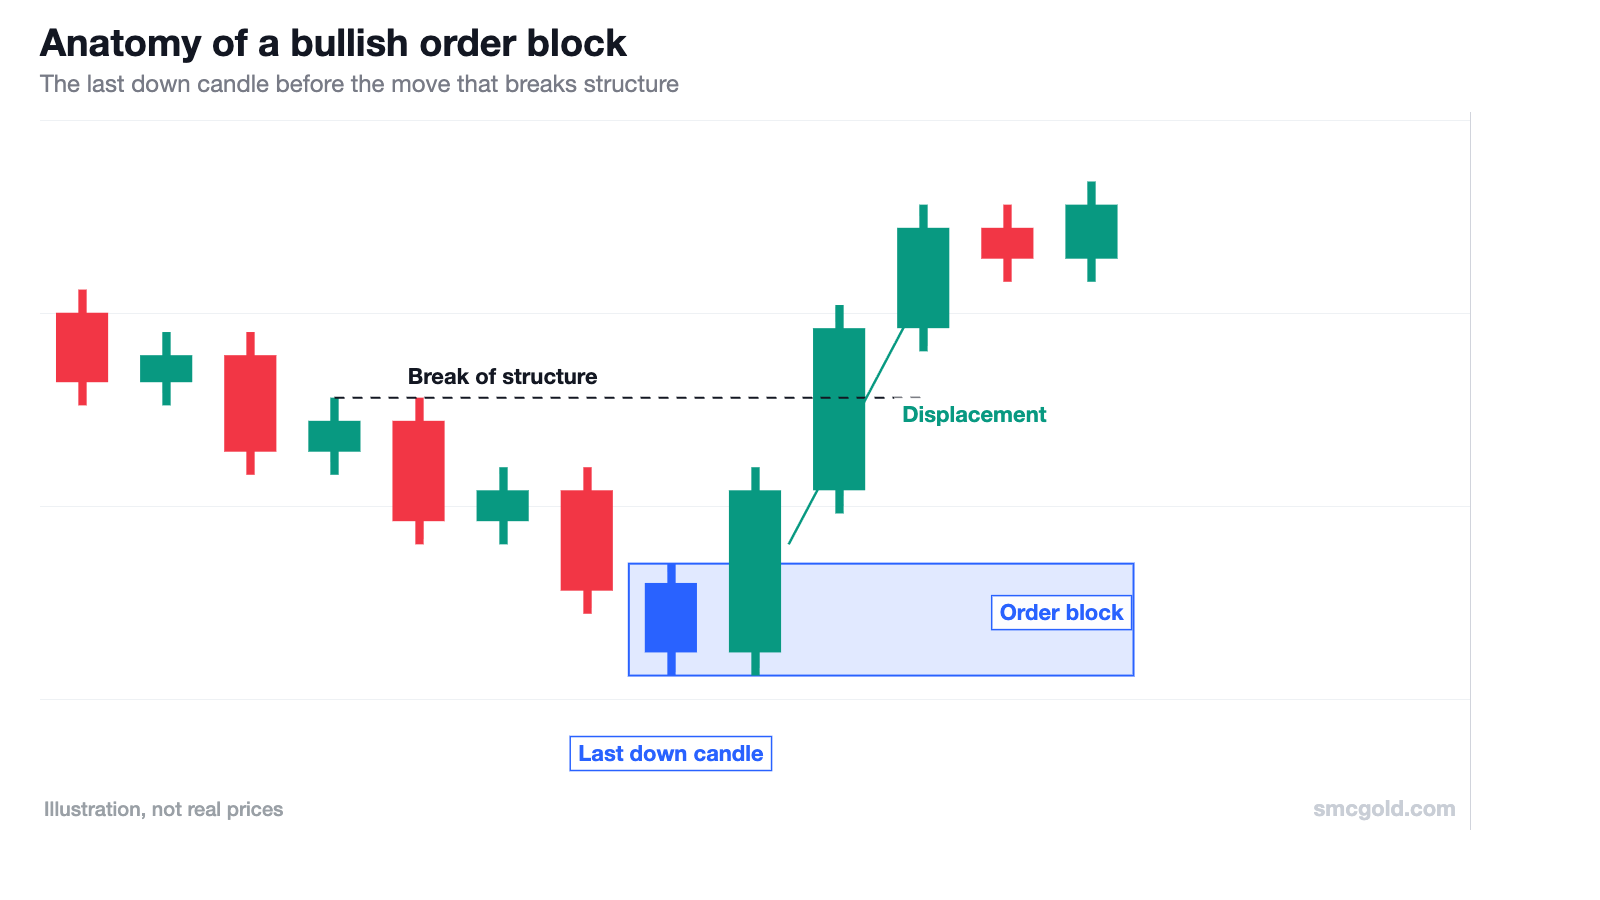
- Find the displacement. Look for a fast, strong move: large bodies, small wicks, often leaving a fair value gap behind it.
- Confirm it broke structure. The move must close beyond a previous swing high (for a bullish OB) or swing low (for a bearish OB). No structure break, no order block.
- Go back to where it started. The last candle of the opposite colour before the displacement is the order block.
- Mark the zone. Most traders mark the full candle range, high to low including wicks. Some use only the body for a tighter zone. Stay consistent.
If several small opposite candles sit together at the start of the move, mark them as one zone, from the highest high to the lowest low of that group.
What makes an order block worth trading
Every move has an order block, so you need a filter. The strongest zones usually tick most of these boxes:
- It took liquidity first. The OB formed at or right after a sweep of an obvious high or low.
- It caused a CHoCH or BOS. The move from the zone broke structure with a body close.
- It left a fair value gap. Displacement that leaves an imbalance (drawn wick to wick) shows urgency.
- It is unmitigated. Price has not returned to it yet. The first return usually gives the cleanest reaction.
- It sits in the right area. Bullish OBs in discount (lower half of the range), bearish OBs in premium (upper half).
- It agrees with the higher timeframe. A 15m bullish OB inside a 4H bullish move is stronger than one fighting the 4H trend.
The order block of the CHoCH leg
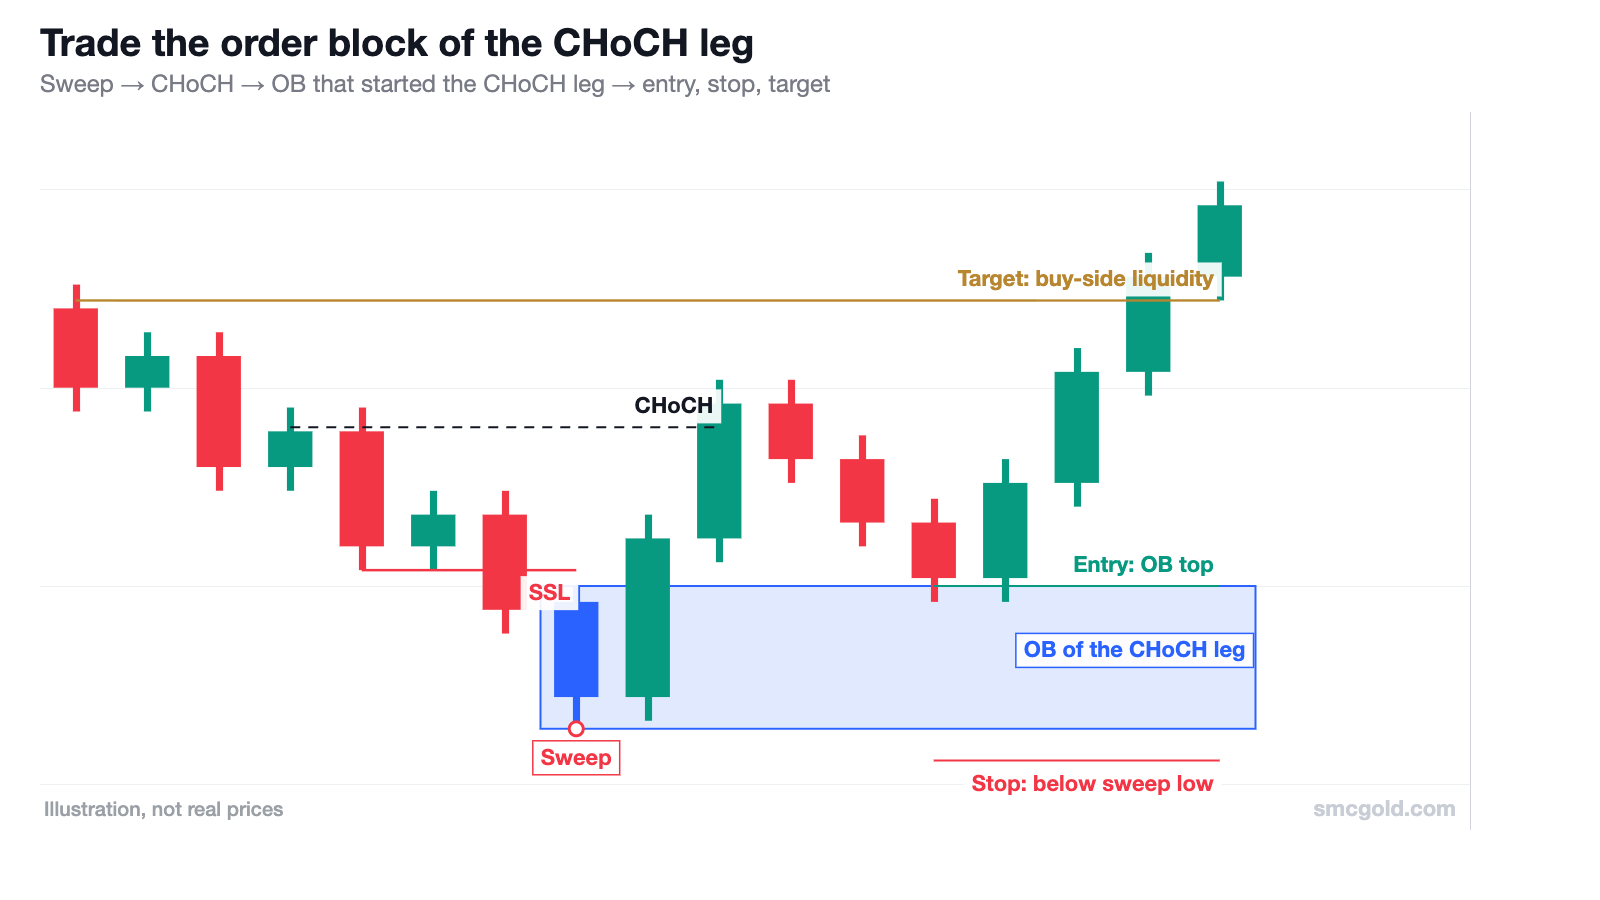
At SMC Gold we focus on one specific zone: the order block that started the CHoCH leg. The sequence is:
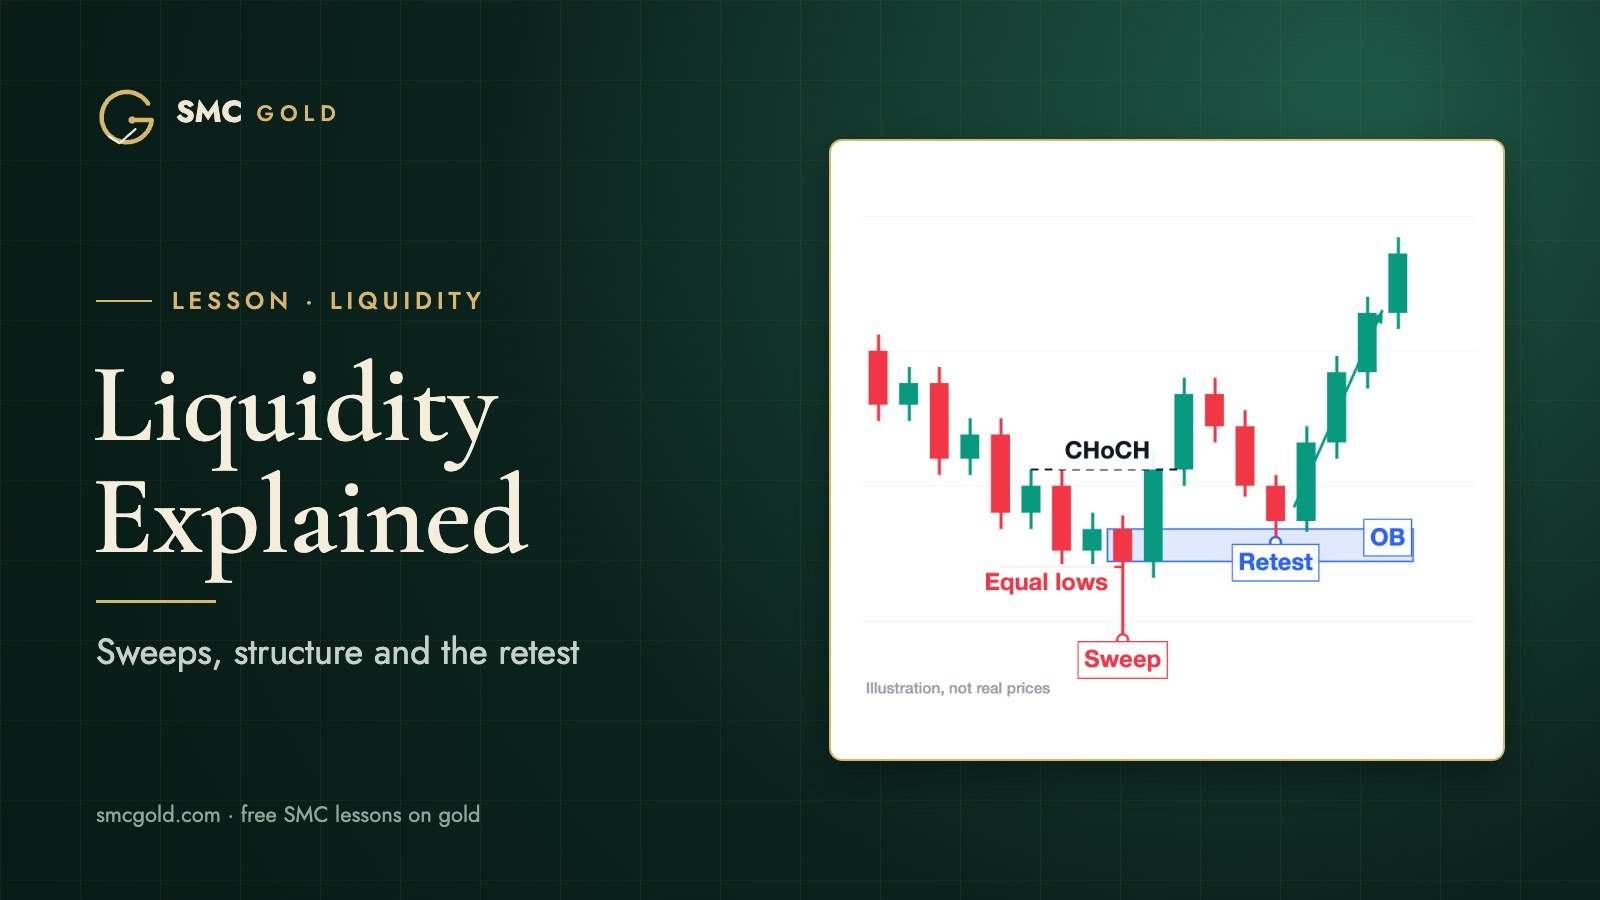
- Price sweeps liquidity (for example, a sell-side sweep below equal lows).
- Price displaces the other way and closes beyond the last swing: the change of character.
- The last opposite candle at the start of that move is the OB of the CHoCH leg.
- We wait for price to come back to it.
This zone combines everything above: liquidity taken, structure shifted, and a clear invalidation point just beyond the sweep.
Entry, stop loss and target
- Entry: the near edge of the OB (top of a bullish OB, bottom of a bearish OB), or the 50% level of the OB for a deeper, more selective entry. The near edge fills more often; the 50% level gives a better price but misses some moves.
- Stop loss: beyond the far edge of the OB, or beyond the sweep extreme if that is further. Add a small buffer for spread.
- Target: the opposite liquidity, such as the equal highs or lows, or the range high or low the move is likely to reach. A common plan is to take partial profit at internal liquidity and leave the rest for the external target.
Work out the risk in money before you enter, and size the position so that being wrong is an acceptable loss.
Lower timeframe confirmation
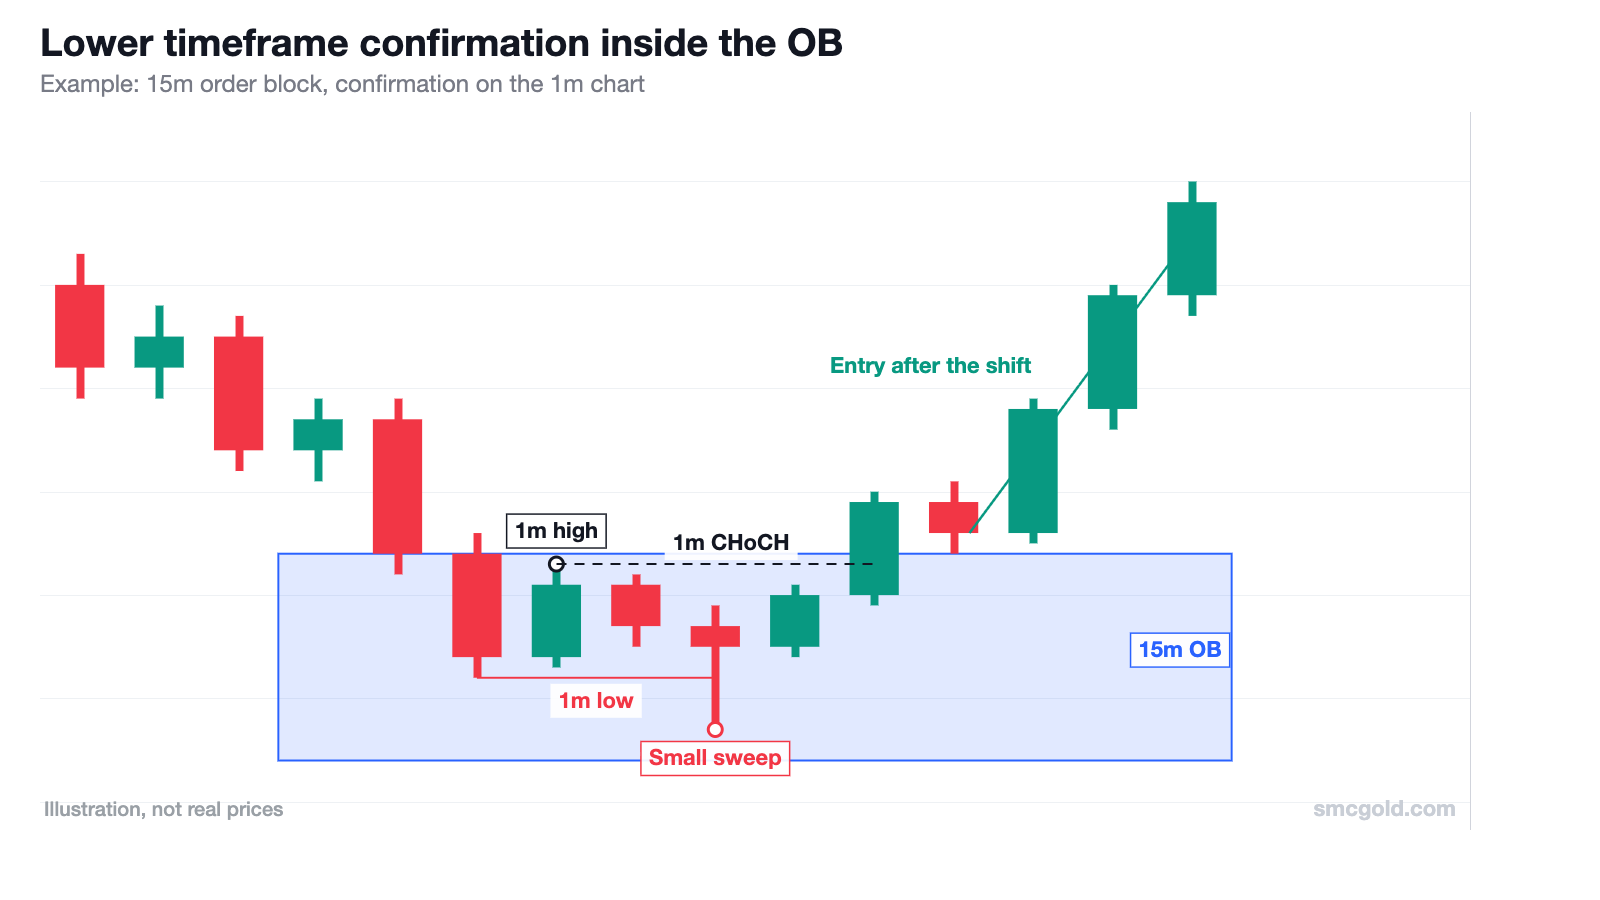
An order block is an area, not a guarantee. Instead of placing a blind limit order, you can wait for price to reach the zone and then drop to a lower timeframe. For a 15m OB, use the 1m or 3m chart:
- Price enters the OB and often sweeps a small 1m low inside it.
- Price then closes above the last 1m high: a CHoCH on the lower timeframe in your direction.
- Enter on the small OB that caused that shift, with the stop beyond the low (or high) inside the zone.
This usually gives a tighter stop and filters out zones that price slices straight through. The cost is that you will sometimes miss a move that reacted without giving a lower timeframe shift.
When an order block fails
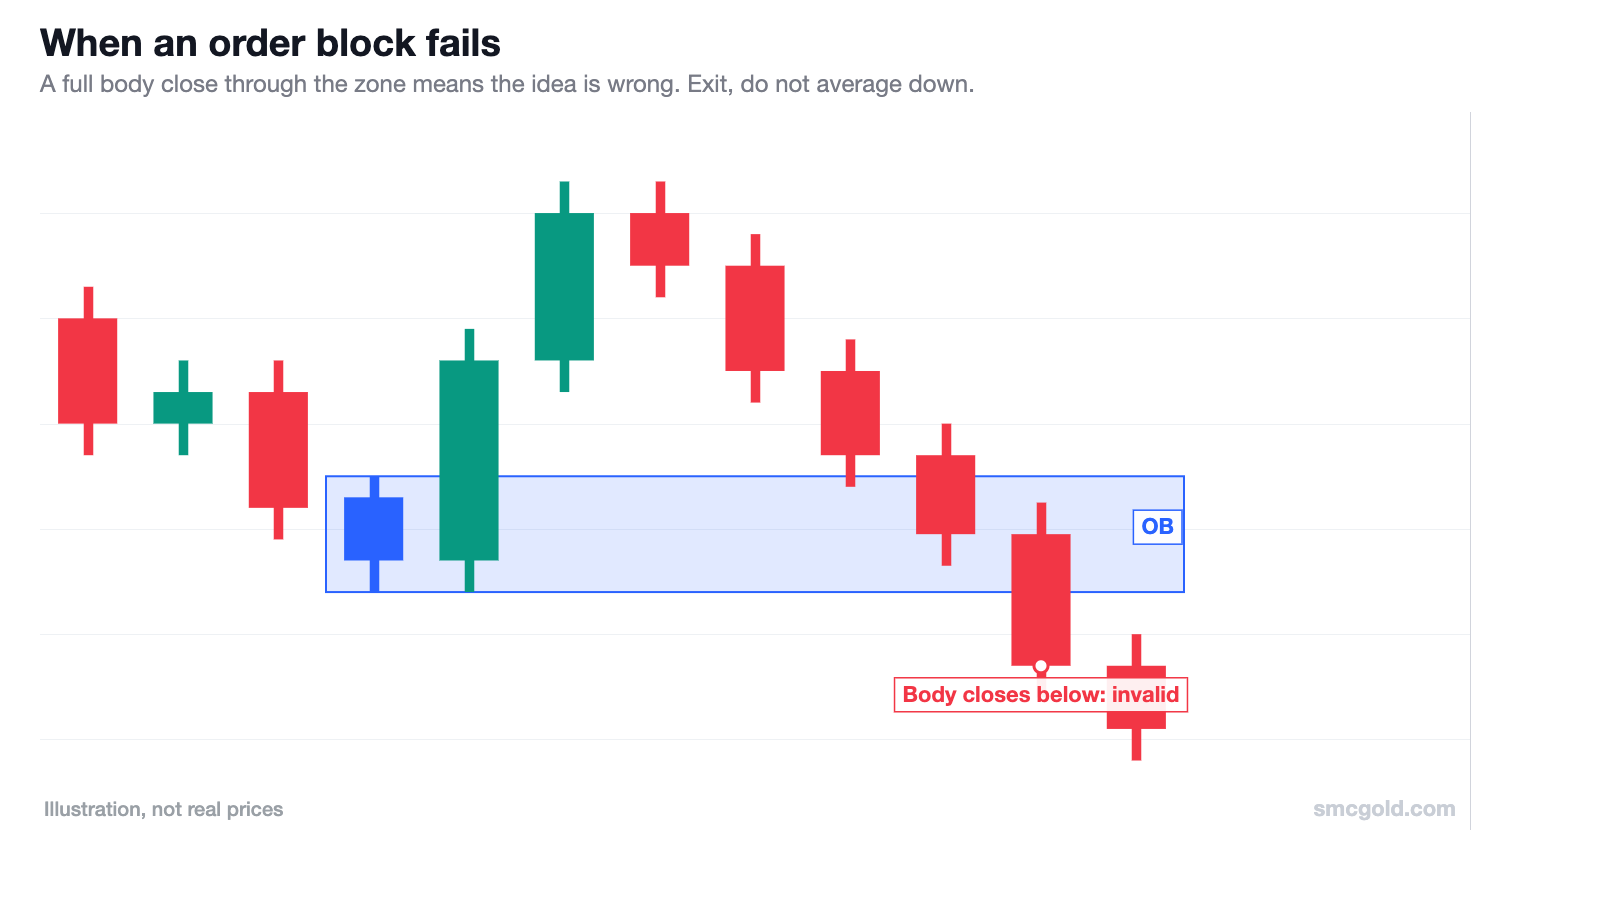
A zone is invalid when a candle on the timeframe you marked the OB on (for a 15m OB, a 15m candle) closes with its body beyond the far edge. A wick through the zone, or a close on a lower timeframe, does not invalidate it on its own. At that point the reason for the trade is gone: exit at your stop, and never add to a losing position to "average down".
Sometimes a failed bullish OB later acts as resistance (and a failed bearish OB as support). Traders call this a breaker block, but usually only when the failure also swept liquidity and broke structure; not every failed OB qualifies. It is a topic for a separate lesson.
Real example: XAUUSD, 14 May 2026
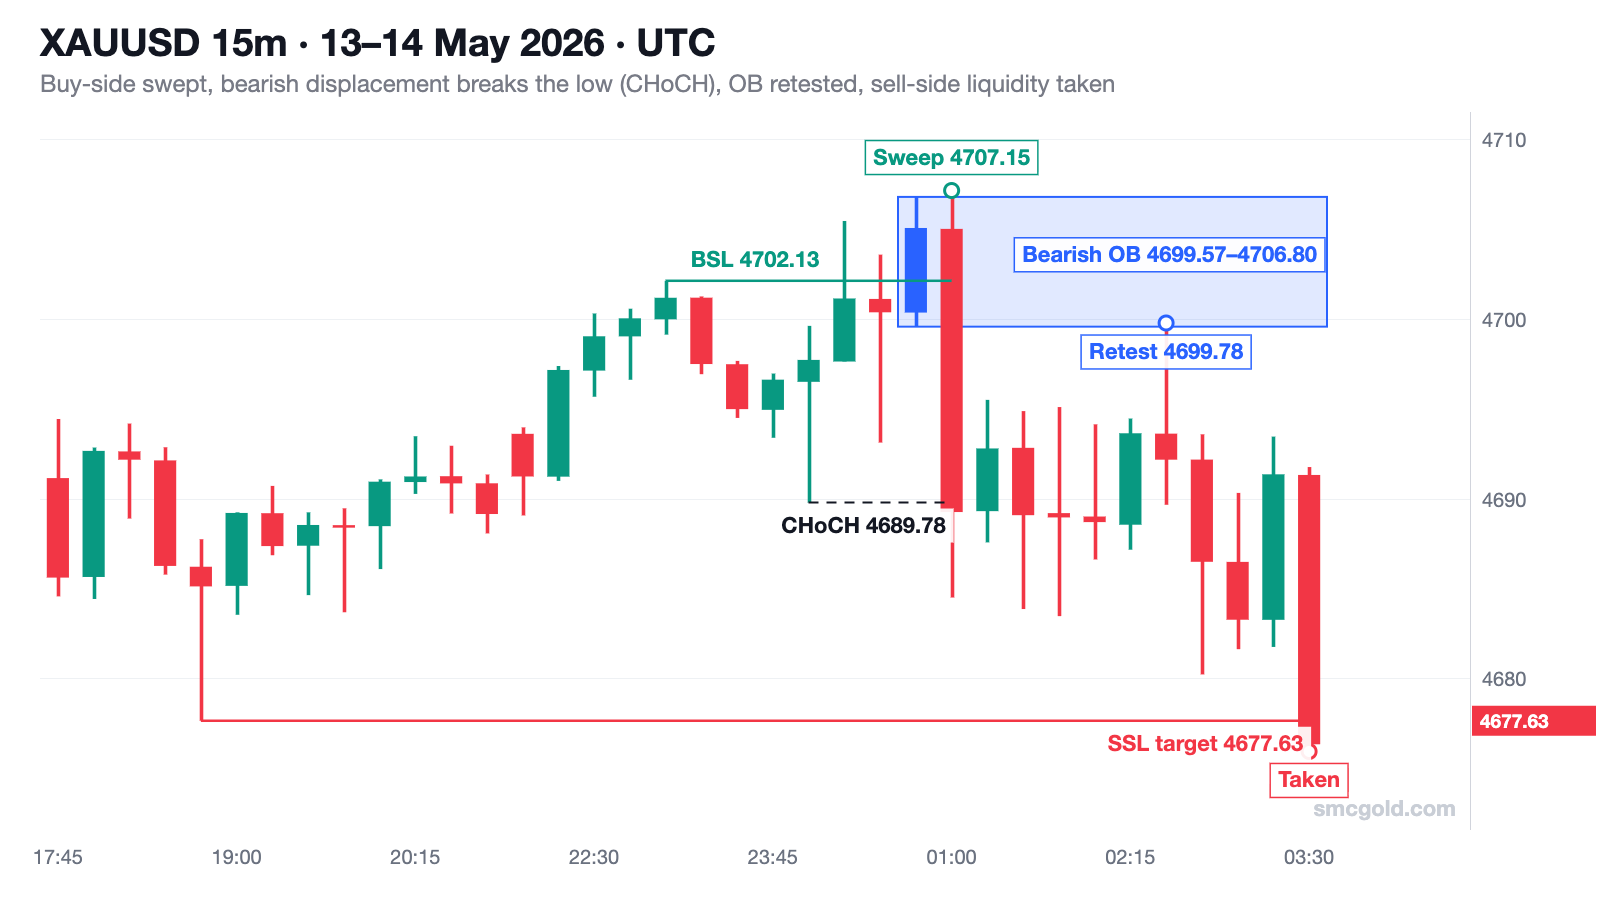
A bearish version of the same model on the 15-minute chart:
- Liquidity: the 23:00 UTC high at 4702.13 was an obvious pool of buy-side liquidity. Below, the 18:45 low at 4677.63 held sell-side liquidity.
- Sweep: just after midnight, price pushed above 4702.13, reaching 4707.15 on the 01:00 candle.
- CHoCH: that same 01:00 candle dropped and closed at 4689.25, below the 00:00 swing low at 4689.78. Structure shifted bearish.
- Order block: the last up candle before the drop, at 00:45 UTC, spans 4699.57 to 4706.80. This is the OB of the CHoCH leg. The drop also left a fair value gap between 4699.57 and 4695.50.
- Return: at 02:30 UTC price came back up to 4699.78, just touching the bottom of the OB, and was rejected.
- Target: at 03:30 UTC price fell through the sell-side liquidity at 4677.63, reaching 4675.92.
A hypothetical entry at the OB edge (4699.57), with a stop above the sweep high (4707.15), would have risked about 7.6 points for about 21.9 points to the target, close to 2.9 times the risk. These figures come from chart prices, not from a broker fill; spread and slippage would change them.
Be honest about the fill: price only touched the OB by about 0.2 points. An order at the 50% level of the zone would not have been filled. This example was picked after the fact to show the idea; it is not a record of a real trade, and many order blocks fail.
Common mistakes
- Marking an OB that did not break structure. Without a BOS or CHoCH it is just a candle.
- Trading the third or fourth return. Each visit uses up the orders in the zone.
- Ignoring where liquidity is. If obvious liquidity sits between you and your target, expect price to take it first.
- Stops inside the zone. Price often wicks deep into an OB before reacting.
- Too much size. Gold can move 10 to 20 points in minutes. Size for the stop, not for the target.
Quick checklist
- Liquidity swept before the move
- Displacement with a body close beyond structure (CHoCH or BOS)
- OB of the CHoCH leg marked, ideally with a fair value gap
- First return to the zone, in line with the higher timeframe
- Lower timeframe shift inside the zone (optional but recommended)
- Stop beyond the zone or sweep; target the opposite liquidity
Risk warning. This article is for education only and is not financial advice. Trading forex and gold carries a high level of risk; you could lose some or all of your money. See our risk disclaimer.
Spotted a mistake? Send a correction.