What you'll learn
On this page
This outlook reads the gold 4-hour chart as it stood on Monday 12 October 2026 at 17:00 UTC, with price near 4,165. It sets out where liquidity rests, which zone we are watching, and what would change the view. It is an opinion for education, not a signal.
Where gold stands
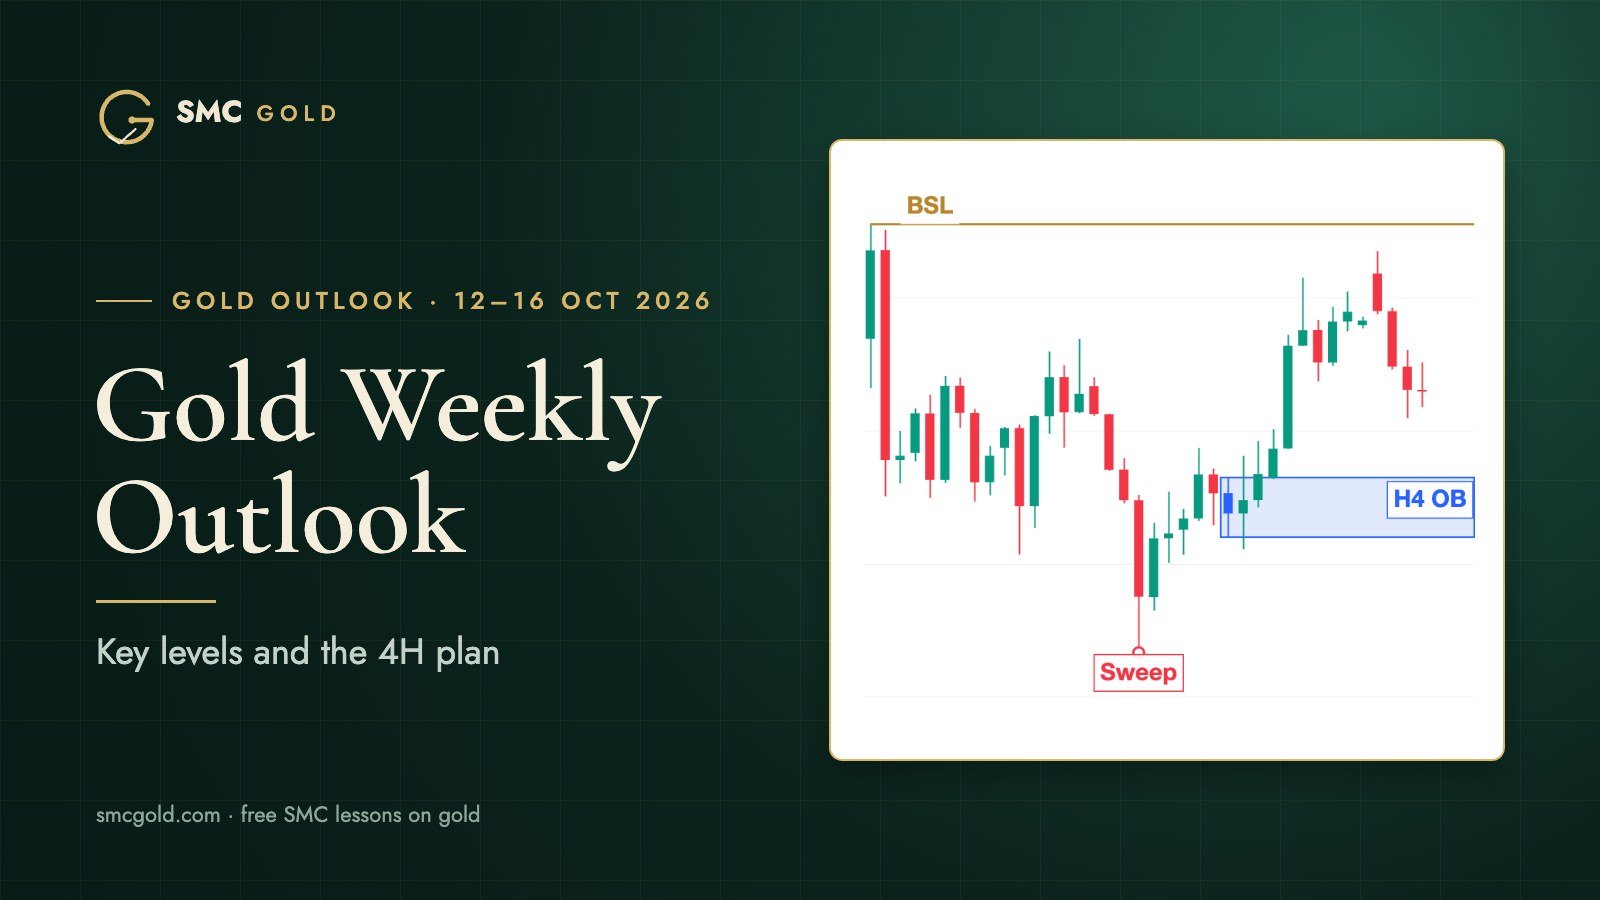
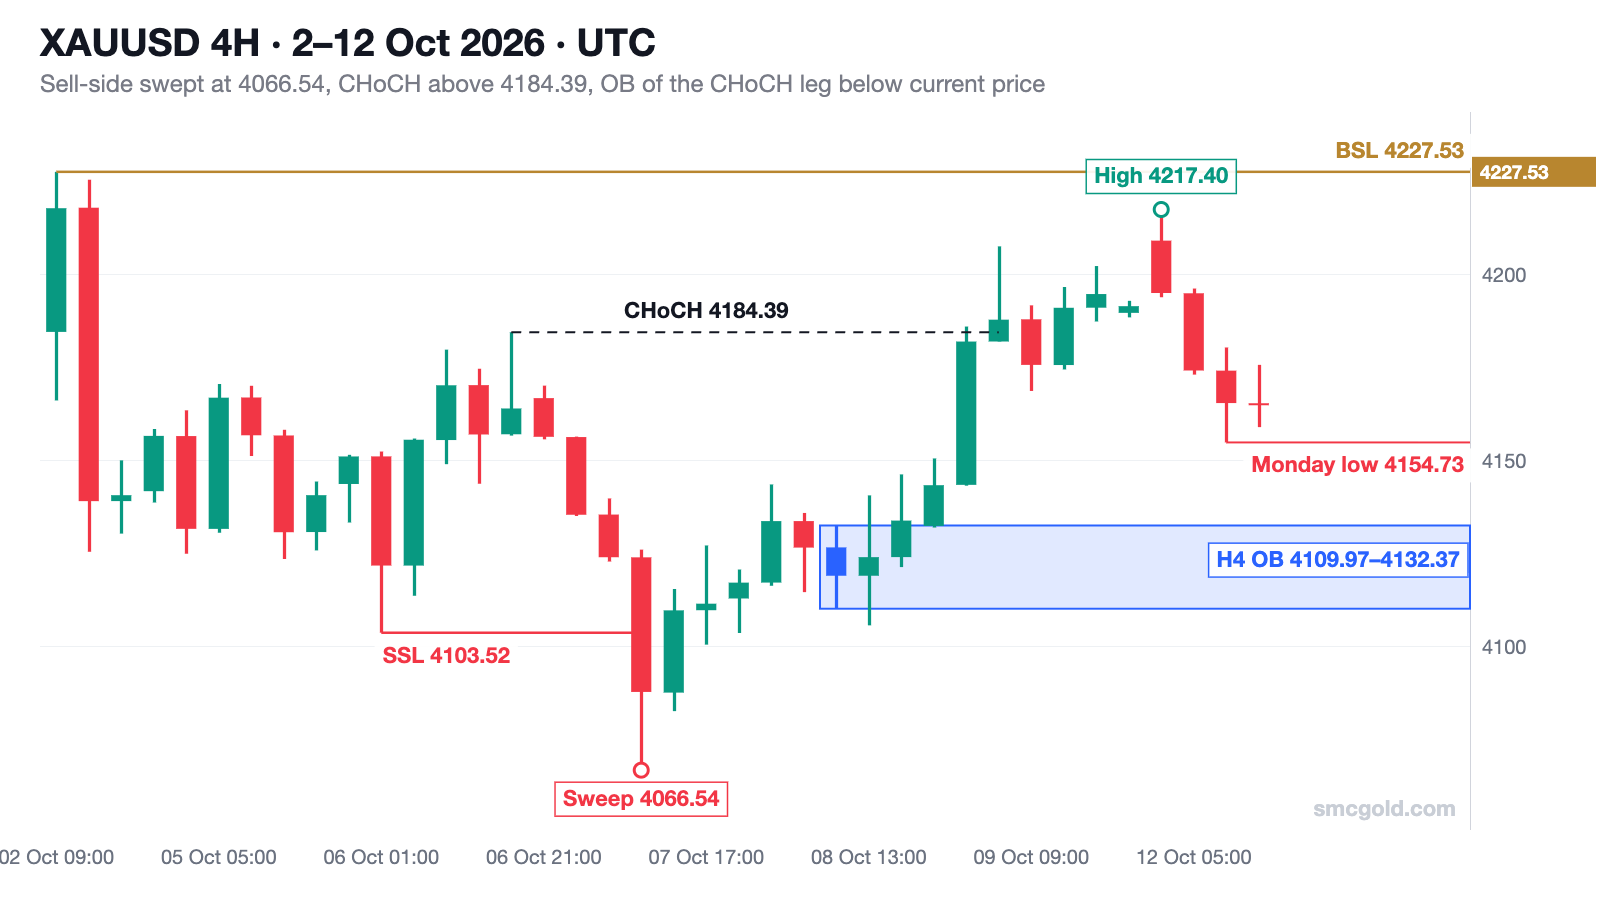
After the sharp drop at the end of September, gold spent the first week of October in a range between roughly 4,103 and 4,227. Inside that range, three things happened that shape this week:
- Sell-side liquidity was swept. On 7 October price ran below the 4,103.52 low of 6 October and reached 4,066.54 before buyers stepped in.
- Structure shifted up. On 9 October the 4-hour candle closed at 4,187.75, above the last lower high at 4,184.39. That is a bullish change of character (CHoCH) on the 4-hour chart.
- Monday took buy-side liquidity, then pulled back. Gold opened the week higher, ran above Friday's 4,207.49 high to 4,217.40, and then fell to a Monday low of 4,154.73.
Key levels this week
| Level | Price | Why it matters |
|---|---|---|
| Buy-side liquidity | 4,227.53 | 2 October high, the top of the range |
| Monday high | 4,217.40 | Took Friday's high, then rejected |
| H4 CHoCH level | 4,184.39 | The high that was broken on 9 October |
| Monday low | 4,154.73 | Nearest sell-side liquidity below price |
| H4 order block | 4,109.97 – 4,132.37 | Last down candle before the CHoCH leg (8 Oct, 09:00 UTC) |
| Swept low | 4,066.54 | The 7 October sweep; the bullish idea fails below it |
The zone we are watching
Following our method, the zone of interest is the order block of the CHoCH leg: the last bearish 4-hour candle before the move that broke 4,184.39. It sits between 4,109.97 and 4,132.37.
Between current price and that zone sits the Monday low at 4,154.73. Sell-side liquidity like this is often taken before a deeper zone is tested, so a move below 4,154.73 would not, on its own, change the bullish structure.
Plan A and Plan B
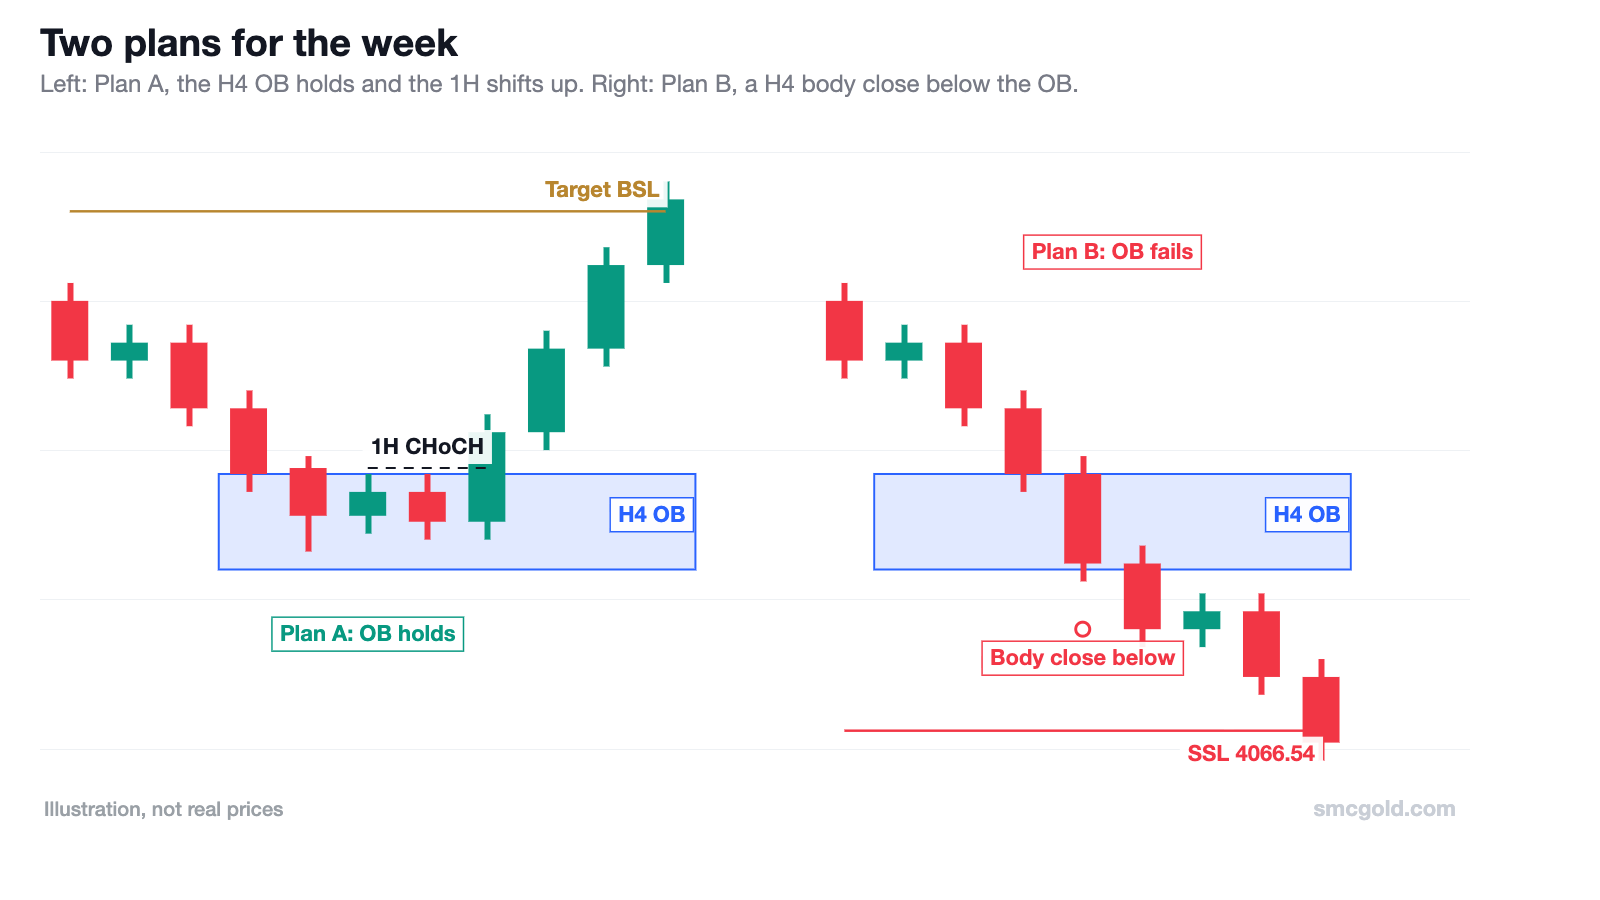
Plan A: the order block holds. If price trades into 4,109.97 – 4,132.37 and the 1-hour chart then shows its own CHoCH up, the structure points back toward the buy-side liquidity at 4,207–4,217 and the range high at 4,227.53. Without that 1-hour shift, the zone is only an area to watch, not an entry.
Plan B: the order block fails. A 4-hour candle body closing below 4,109.97 would invalidate the bullish idea. The next obvious sell-side liquidity would then be the 4,066.54 sweep low.
In between: if price simply rotates between 4,154 and 4,217 without reaching either side, there is no setup. Waiting is a position.
What could change the picture
- Scheduled US data and Fed speakers can push gold through levels in minutes. Check the economic calendar each morning and avoid entering just before high-impact releases.
- Weekend and Monday gaps, like this week's open, can leave levels untested.
- Higher timeframe: on the daily chart gold is still below the late-September breakdown, so the 4-hour bullish shift is a recovery inside a bigger range, not a confirmed new trend.
Important: this outlook was written on 12 October 2026 from the chart at that time. Markets move; by the time you read it, levels may already have been reached or invalidated. It is not a recommendation to buy or sell. Size every position so that a loss is acceptable, as explained in Risk and Psychology for Gold Traders.
Quick checklist
- Mark 4,227.53, 4,184.39, 4,154.73, the OB 4,109.97 – 4,132.37 and 4,066.54
- Wait for price to reach the OB; do not chase in the middle of the range
- Look for a 1-hour CHoCH inside the zone before considering a long
- Treat a 4-hour body close below 4,109.97 as invalidation
- Check the news calendar before every session
Risk warning. This article is for education only and is not financial advice. Trading forex and gold carries a high level of risk; you could lose some or all of your money. See our risk disclaimer.
Spotted a mistake? Send a correction.